Storage usage metrics — used space, requests, traffic, and number of objects — are available in the Statistics section of the CDB Technical Web Portal and used for billing.
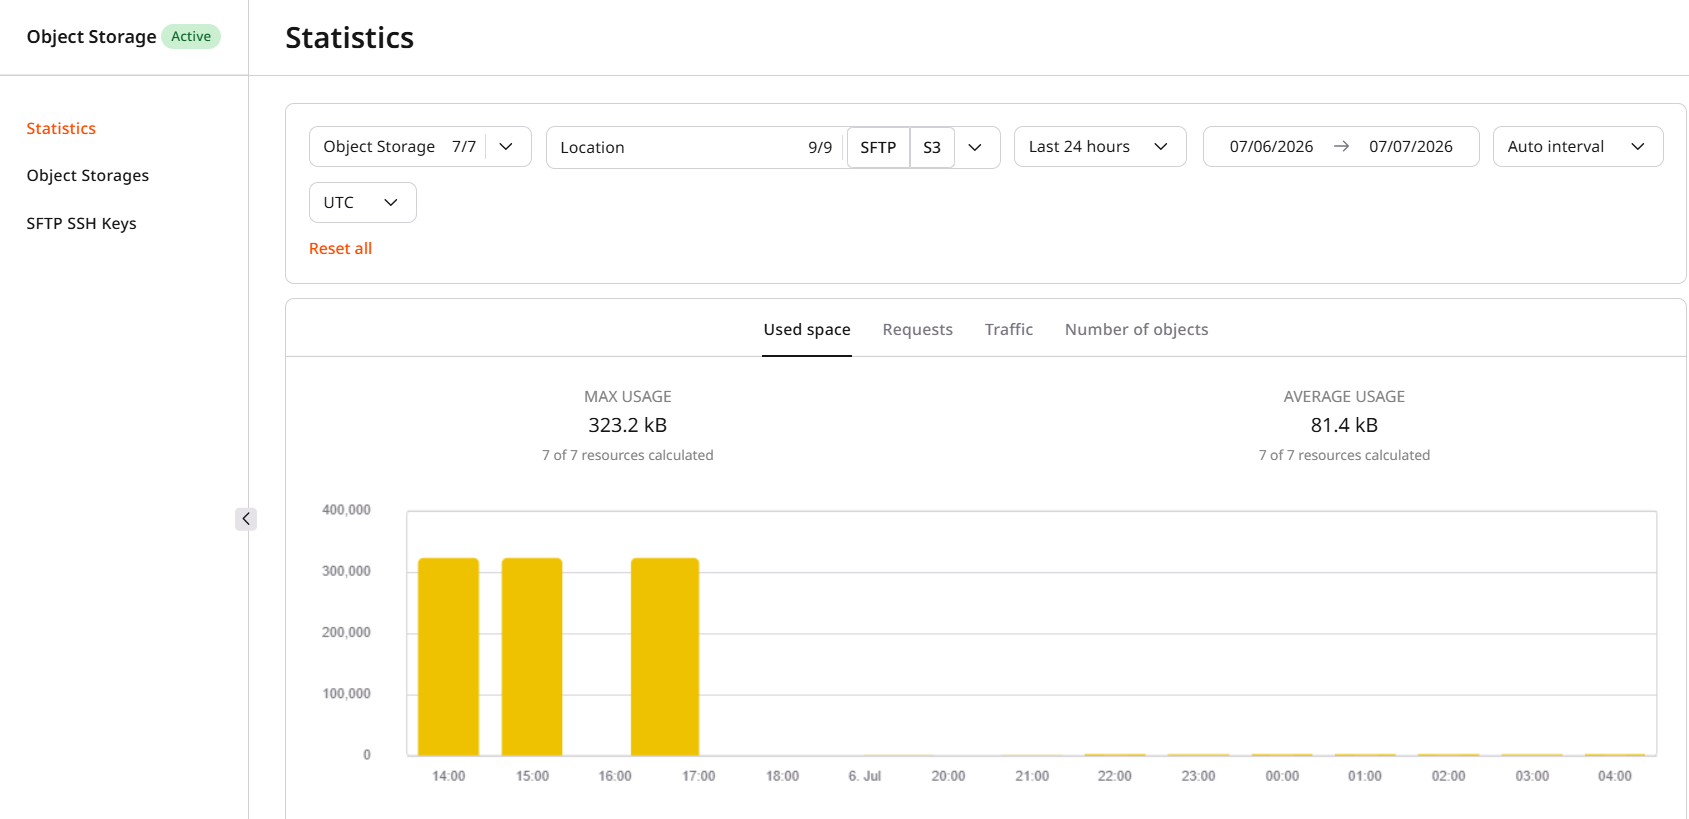
The page supports filtering by time period (last 24 hours, last 48 hours, last week, last month, last year, or a custom date range), storage type (S3 or SFTP), location, and storage name. The Used space tab shows max and average usage for the selected period:
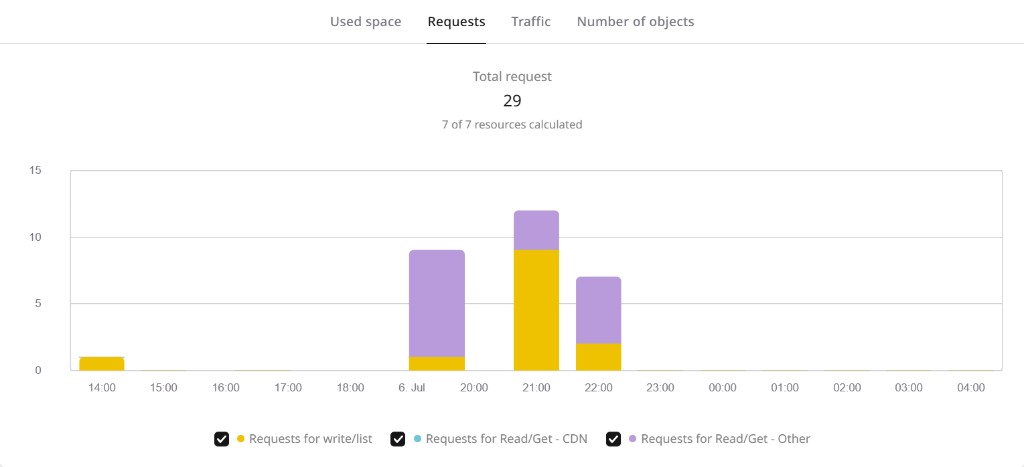
The Requests tab shows total request count broken down into write/list requests, Read/Get via CDN, and Read/Get via other sources:
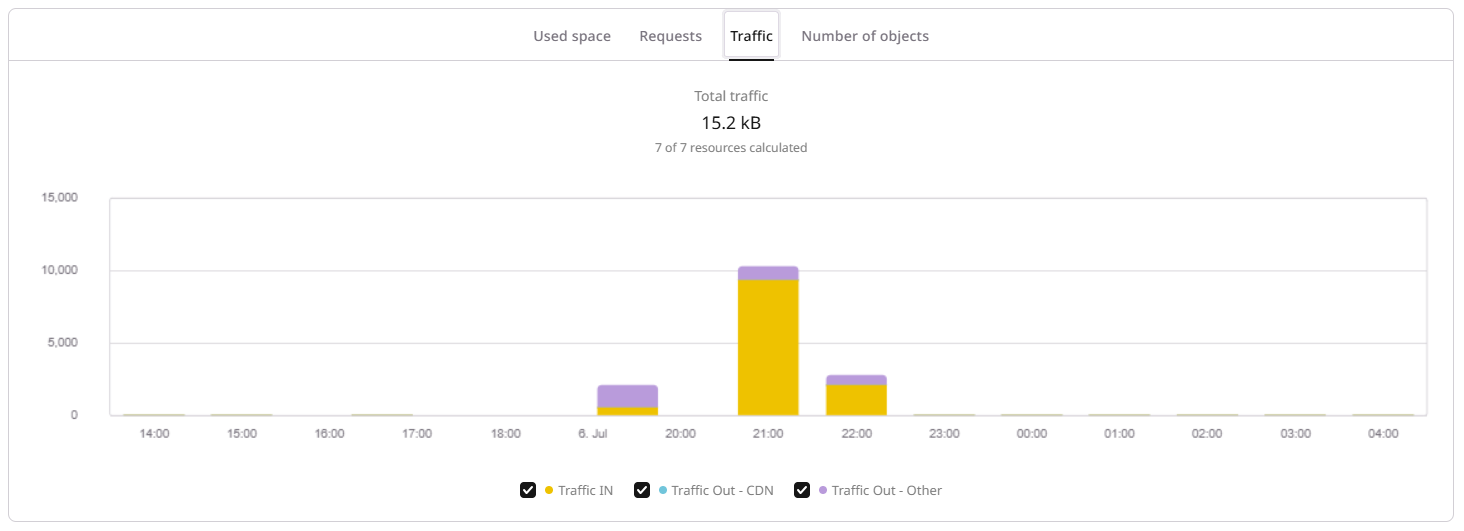
The Traffic tab breaks traffic down into Traffic IN, Traffic Out - CDN, and Traffic Out - Other:
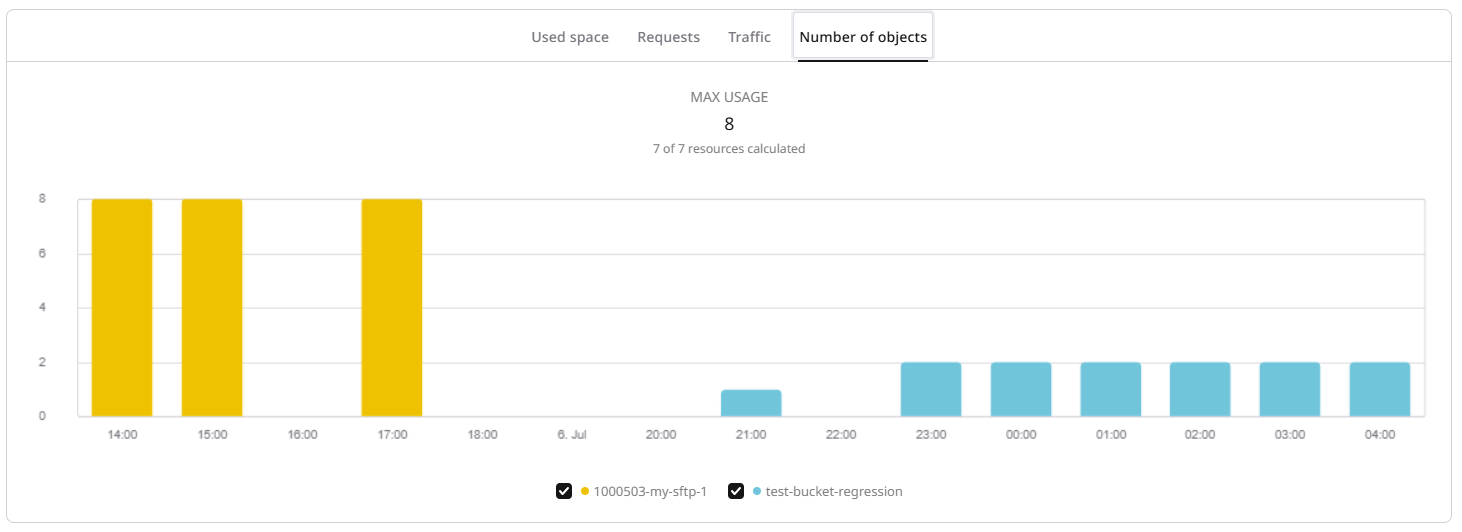
The Number of objects tab shows the maximum object count per storage for the selected period:
Statistics are not available immediately — data appears in the portal within a couple of hours after storage creation. Requests for longer periods — a year of data — may take more time to process.
Used space is rounded to the nearest whole GB for billing. For SFTP storage, system files — SSH keys, empty directories, and a robots.txt file — account for about 350 kB of used space. If a storage was created but no files have been uploaded, statistics will reflect only this system-file space.
Two endpoints return storage usage metrics: one for aggregated totals over a date range, and one for time-series data grouped by hour or day. Both support filtering by location and storage name.
Returns a single set of metrics — max used space, request counts, traffic volumes, and max object count — aggregated over the specified date range. All request body fields are optional.
Parameter
Description
from
Start date in YYYY-MM-DD format. Defaults to 30 days ago.
to
End date in YYYY-MM-DD format. Defaults to today.
locations
Filter by location names, e.g. s-ed1, ams.
storages
Filter by full storage name in {client_id}-{storage_name} format.
from gcore import CDB

client = CDB()  # reads GCORE_API_KEY

totals = client.storage.statistics.get_usage_aggregated(
    from_="2026-07-01",
    to="2026-07-13",
)

m = totals.data[0].metrics
print(f"Max used space:      {m.size_sum_max} bytes")
print(f"Avg used space:      {m.size_sum_mean} bytes")
print(f"Total requests:      {m.requests_sum}")
print(f"  Write/list:        {m.requests_in_sum}")
print(f"  Read via CDN:      {m.requests_out_edges_sum}")
print(f"  Read via other:    {m.requests_out_wo_edges_sum}")
print(f"Total traffic:       {m.traffic_sum} bytes")
print(f"  Traffic IN:        {m.traffic_in_sum} bytes")
print(f"  Traffic Out CDN:   {m.traffic_out_edges_sum} bytes")
print(f"  Traffic Out other: {m.traffic_out_wo_edges_sum} bytes")
print(f"Max objects:         {m.file_quantity_sum_max}")
print(f"Billing (byte·h):    {m.size_sum_bytes_hour}")
Returns metrics grouped by time interval, broken down by location and storage. Use this endpoint to build charts or detect usage spikes over time.
Parameter
Description
from
Start date in YYYY-MM-DD format.
to
End date in YYYY-MM-DD format.
granularity
Time interval for grouping: 1h, 12h, or 24h. Defaults to 24h.
ts_string
When true, timestamps use RFC3339 format; when false (default), Unix timestamps.
locations
Filter by location names.
storages
Filter by full storage name in {client_id}-{storage_name} format.
from gcore import CDB

client = CDB()  # reads GCORE_API_KEY

series = client.storage.statistics.get_usage_series(
    from_="2026-07-01",
    to="2026-07-13",
    granularity="24h",
    ts_string=True,
)

for client_id, client_data in series.data.clients.items():
    print(f"Client {client_id}:")
    for loc_name, loc_data in client_data.locations.items():
        print(f"  Location {loc_name}:")
        for storage_name, storage_data in loc_data.storages.items():
            print(f"    Storage {storage_name}:")
            for ts, val in storage_data.size_max_series:
                print(f"      {ts}: {val} bytes (max size)")