Create a Grafana alert rule
A Grafana alert rule compares CDN, DNS, CDB EdgeCompute, or WAAP statistics from the CDB Platform-EN data source in the Grafana plugin with a threshold and changes state when the condition is met. Grafana can send a notification through a contact point.
Create a contact point
A contact point is the destination for a firing alert, and the alert rule requires one. Email is the default integration, and the fields under Integration change with the selected receiver.
- 1
Open contact points
Open Alerting > Notification configuration. Stay on the Contact points tab, then click New contact point.
The same page also opens from View or create contact points on the alert rule.
- 2
Set the name and the email addresses
In Name, enter a name for this destination.
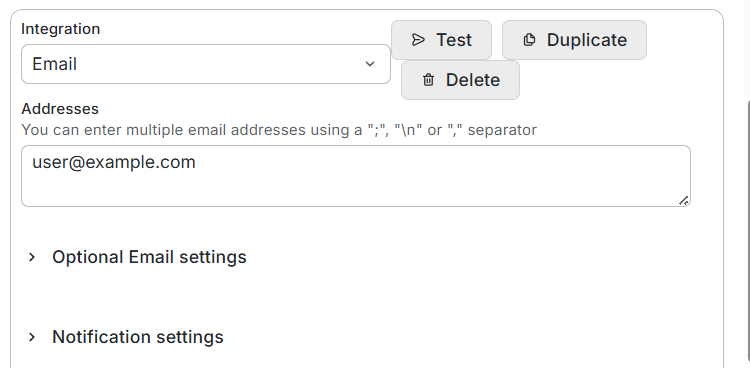
Leave Integration on Email, or select another receiver. Test, Duplicate, and Delete are next to the integration.
In Addresses, enter one or more addresses. Separate them with a semicolon, a comma, or a new line.
- 3
(Optional) Set the email fields
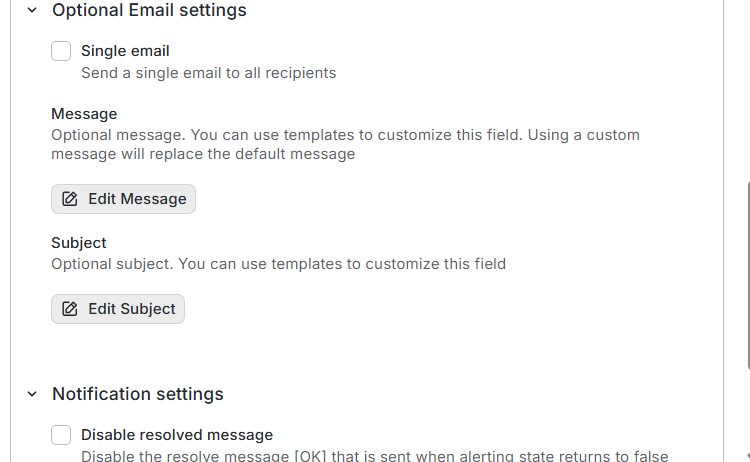
Optional Email settings and Notification settings can stay collapsed.
- Single email: sends one message to every address.
- Message: replaces the default message. Edit Message opens the template editor.
- Subject: replaces the default subject. Edit Subject opens the template editor.
- Disable resolved message: stops the OK message sent when the alert returns to normal.
- 4
Save the contact point
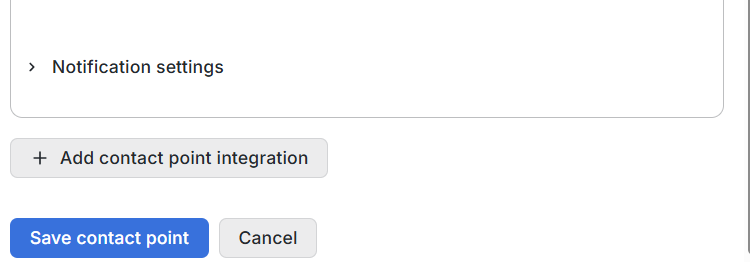
Add contact point integration attaches another receiver to the same contact point. Click Save contact point.
Create the alert rule
The rule form is one page, and its query editor matches the dashboard panel editor. The service fields are the ones in the statistics article for that product.
- 1
Open a new alert rule
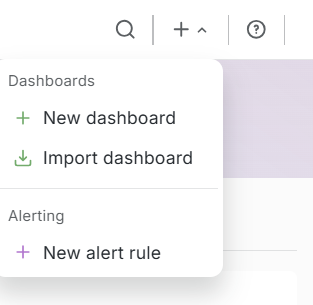
In the top bar, click +, then New alert rule.
- 2
Name the rule
In Name, enter a name that states what the rule watches.
- 3
Set the query
On query A, select the CDB Platform-EN data source and set Service. The fields under Query Props depend on that service:
- CDN: Metric, Granularity, Group By, and optional filters.
- DNS: Zone, Granularity, and Record type.
- CDB EdgeCompute: App Name, Metric, and Step (s).
- WAAP: Metric and Granularity.
The time-range chip defaults to the last 10 minutes, so set a range that includes at least one point at the selected granularity. With 1h granularity, a 10-minute range can return no points, and the rule then uses the no-data state.
For an hourly CDN request count, set Service to CDN, Metric to Total Requests, Granularity to 1h, Group By to Resource, and the time range to the last 6 hours. The query returns one series per CDN resource, and each point is the number of requests in that hour. Set the threshold in Compare several series.

- 4
Compare one series
Leave Advanced options off for a WAAP query, a DNS query, a CDB EdgeCompute query, or a CDN query without Group By, because each returns one series.
Under Alert condition, set WHEN to Last, which uses the latest point, and leave OF QUERY. Set IS ABOVE to the threshold. To check the result before saving, click Preview alert rule condition.

- 5
Compare several series
Turn Advanced options on when a CDN query uses Group By, because the query returns one series per group. DNS, CDB EdgeCompute, and WAAP stay on the one-series condition.
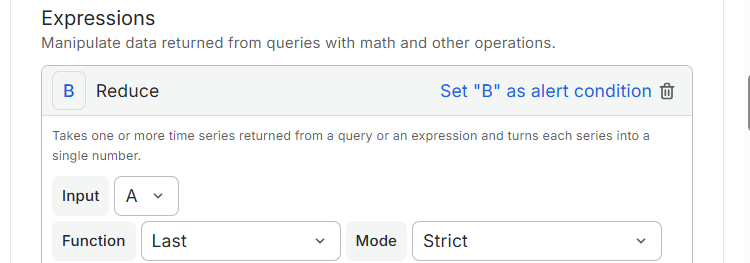
Reduce turns each series into one number. Set Input to A, Function to Last, and Mode to Strict. Strict returns NaN when a series contains non-numeric data.
Threshold compares that number. Set Input to B, and for the CDN request query set IS ABOVE to
100. The green Alert condition badge must stay on Threshold, because that expression is the one Grafana evaluates.Click Preview. The preview lists one instance per resource, and an instance matches when the latest point is above 100. The alert fires after that match lasts for the pending period, which defaults to 1m.
Leave Custom recovery threshold off, so the alert clears at the same threshold that fired it.
- 6
Store the rule in a folder
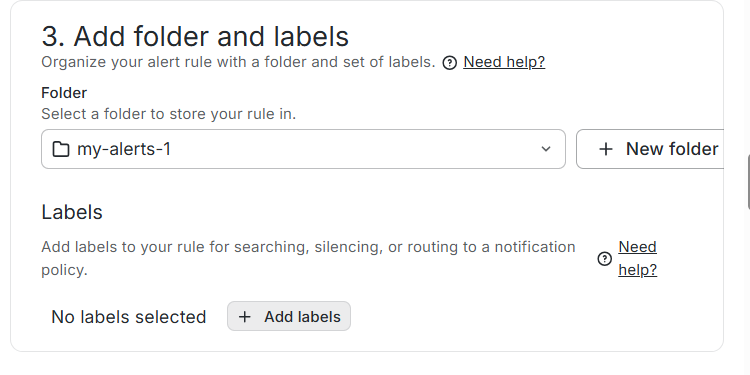
A folder is required. Select one, or create one:
- Click New folder.
- Enter a Folder name.
- Click Create.
(Optional) Add labels to search, silence, or route the rule:
- Click Add labels.
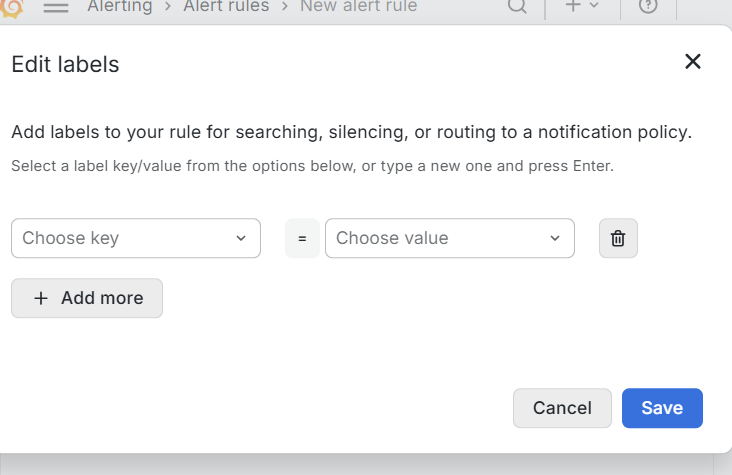
- In Edit labels, set Choose key and Choose value, or enter a new key or value and press Enter.
- Click Add more for each extra label.
- Click Save.
- 7
Set how often the rule runs
New evaluation group stays disabled until a folder is selected.
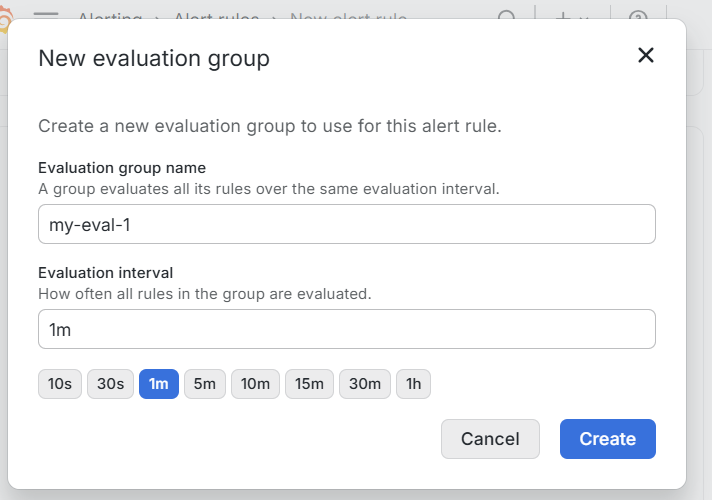
- Click New evaluation group.
- Enter an Evaluation group name.
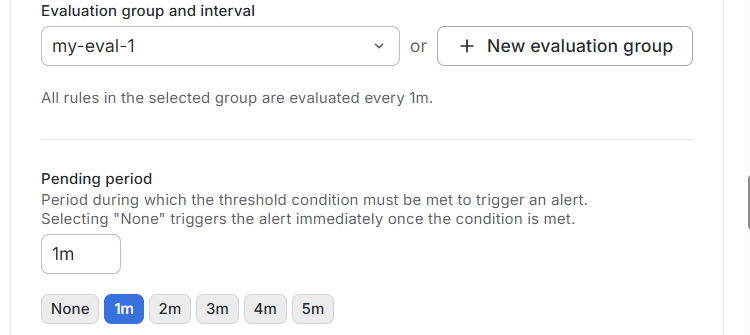
- Set Evaluation interval. The default is 1m, and every rule in the group uses that interval.
- Click Create.
The group name then appears in Evaluation group and interval, and the line under the field states the interval.
Pending period is how long the condition must stay true before the alert fires. None fires on the first matching evaluation, and the default is 1m.
- 8
Set the firing duration and empty queries
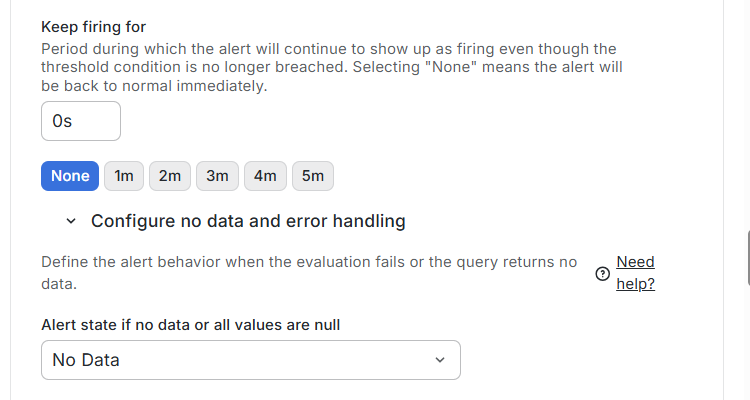
Keep firing for holds the alert after the condition clears. None, shown as
0s, returns the alert to normal immediately, and the other durations match the pending period.Open Configure no data and error handling when an empty or failed query should not use the defaults.
- Alert state if no data or all values are null: No Data is the default.
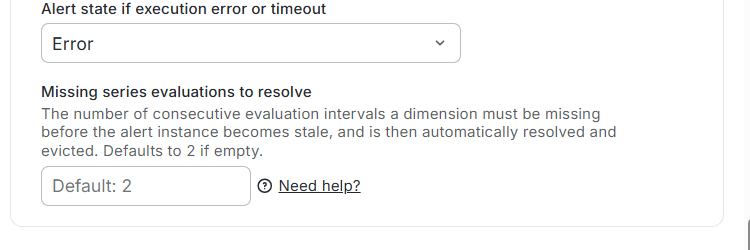
- Alert state if execution error or timeout: Error is the default.
- Missing series evaluations to resolve: consecutive intervals a series must be missing before that instance is resolved and dropped. The default is 2.
- 9
Select who is notified
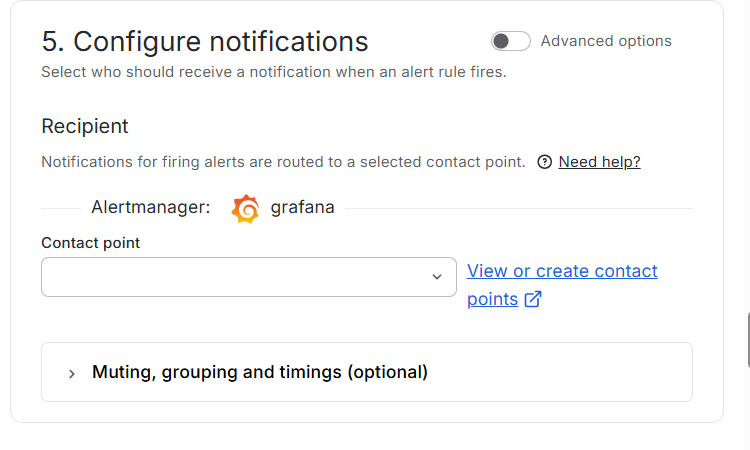
To select a contact point, leave Advanced options off. Alertmanager stays grafana. In Contact point, select the contact point saved earlier. Save reports Contact point is required until this field is set.
To route the alert through a notification policy instead, turn Advanced options on. The default policy in Grafana notification policies groups by
grafana_folderandalertname, waits 30 seconds to group instances, waits 5 minutes before sending an update, and repeats every 4 hours. New notification policy and Add route are on the Notification policies tab.(Optional) On the Time intervals tab next to Contact points, click New time interval. Mute timings and Active timings select that interval.
- Mute timings: a time interval during which notifications are not sent. Filled fields in mute timings must match the current moment, and a blank field matches any moment.
- Active timings: Grafana sends notifications only while the interval matches.
- Override grouping: the default grouping is
grafana_folder, alertname. - Override timings: replaces the default policy values for Group wait, Group interval, and Repeat interval.
- 10
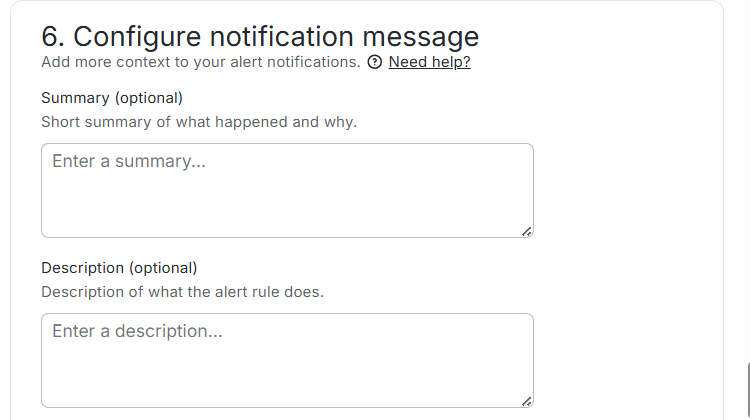
Write the notification message
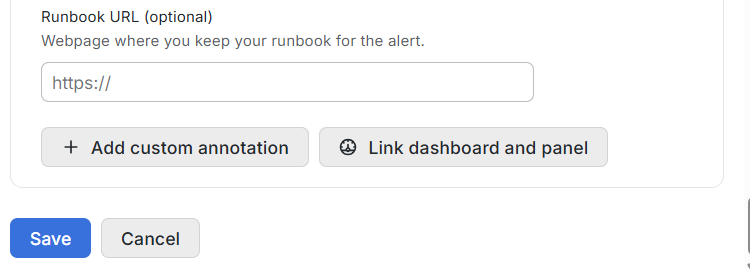
Summary states what happened, and Description states what the rule checks. Both can stay empty. For the CDN request rule, enter
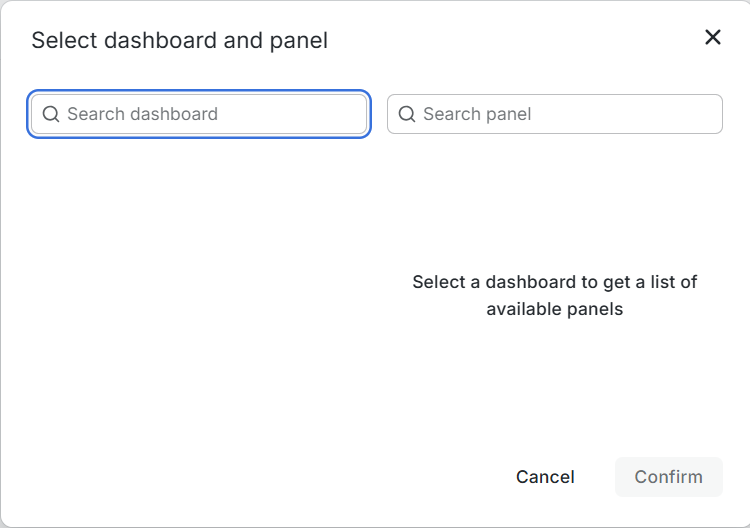
CDN requests in the latest hour exceeded 100in Summary.Runbook URL links to the runbook for this alert. Add custom annotation adds a name and a content field. Link dashboard and panel opens Select dashboard and panel:
- Search for the dashboard.
- Search for the panel.
- Click Confirm.
- 11
Save the rule
Click Save. Grafana stores the rule in the selected folder and lists it under Alerting > Alert rules.